
FIGURE
Fig. 6
Fig. 6
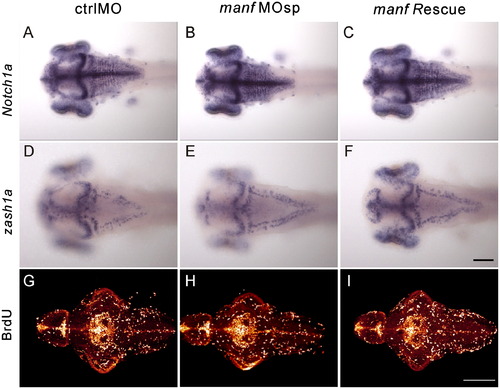
Expression pattern of Notch1a, zash1a and BrdU labeled cells did not alter. Spatial distribution of Notch1a and zash1a was revealed by whole mount in situ hybridization at 2 dpf control MO, manf MOsp and manf RNA rescued morphants. BrdU saturation label analysis was performed in 5 dpf fish. (A–C) The dorsal view of Notch1a expression pattern. (D–F) The dorsal view of zash1a expression pattern. (G–I) The dorsal view of BrdU labeled cells. Scale bar=100 μm. |
Expression Data
| Genes: | |
|---|---|
| Fish: | |
| Knockdown Reagents: | |
| Anatomical Term: | |
| Stage: | Long-pec |
Expression Detail
Antibody Labeling
Phenotype Data
| Fish: | |
|---|---|
| Knockdown Reagents: | |
| Observed In: | |
| Stage: | Long-pec |
Phenotype Detail
Acknowledgments
This image is the copyrighted work of the attributed author or publisher, and
ZFIN has permission only to display this image to its users.
Additional permissions should be obtained from the applicable author or publisher of the image.
Reprinted from Developmental Biology, 370(2), Chen, Y.C., Sundvik, M., Rozov, S., Priyadarshini, M., and Panula, P., MANF regulates dopaminergic neuron development in larval zebrafish, 237-249, Copyright (2012) with permission from Elsevier. Full text @ Dev. Biol.