
Fig. 3
- ID
- ZDB-FIG-121116-25
- Publication
- Nikolaou et al., 2012 - Parametric functional maps of visual inputs to the tectum
- Other Figures
- All Figure Page
- Back to All Figure Page
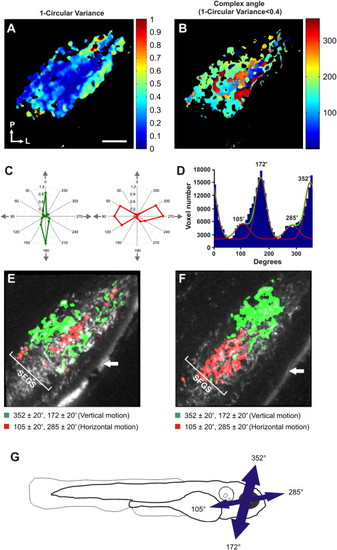
Orientation-Selective Responses Are Broadly Distributed throughout SFGS(A) Voxel-wise analysis of 1 circular variance from a single larva. Voxels are color coded according to 1 circular variance (scale to the right). (B) A threshold (1 circular variance < 0.4) applied to the map shown in (A) reveals orientation-selective voxels. Color coding represents the complex angle. (C) Polar plots showing highly orientation-selective responses in individual voxels (color coding as in B). (D) Distribution of complex angles of all orientation-selective voxels. (Data are from 23 different optical sections from 9 larvae.) Fitted bimodal von-Mises distributions reveal two populations of orientation-selective response centered at 352°(+180°) and 105°(+180°) (relative fractions of the total are 0.54 and 0.17, respectively). The baseline population represents the nontuned population of voxels responding approximately equally to all orientations (0.28). (E and F) Parametric maps of two larvae illustrating the spatial arrangement of the two populations of orientation-selective responses in the deeper portion of SFGS. White arrow indicates skin autofluorescence. (G) Preferred angles of orientation-selective responses relative to the larval body axis. Arrows are scaled to reflect relative proportion of voxels in each population. Scale bar represents 20 μm in (A), as well as in (B), (E), and (F). |