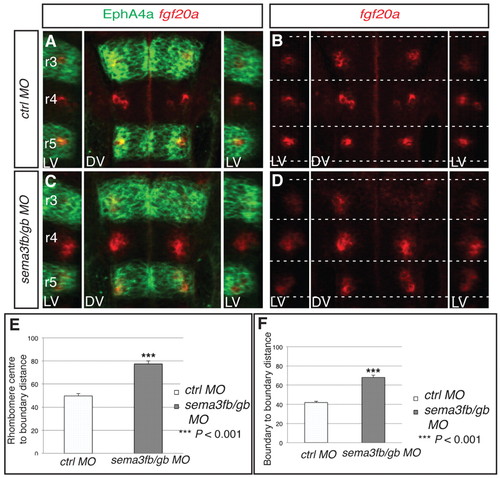
Sema3fb and Sema3gb position fgf20a neurons. (A-D) fgf20a expression (red) combined with EphA4 antibody staining (green) at 24 hpf in zebrafish embryos injected with control MO (A,B) or sema3fb+sema3gb MO (C,D). Dashed white lines indicate the position of boundary marker expression. Left and right reconstructed lateral views (LV) plus dorsal views (DV) are shown. Knockdown of sema3fb+sema3gb disrupts the organisation of fgf20a neurons (79%, n=24). (E,F) The average distance from fgf20a neuronal clusters to boundary (E) and average AP length of clusters (F); see Fig. 2 legend for methodology. In control MO embryos, the average distance to the boundary is 49.7±2.1 A.U. (n=24); in sema3fb+sema3gb MO embryos this increases to 77.4±2.8 A.U. (n=24; P=2.2×10⁻⁸), resulting in sema3fb+sema3gb clusters being on average half the distance from boundaries than control clusters. In control MO embryos the average cluster length is 41.8±1.4. A.U. (n=24), which increases in sema3fb+sema3gb MO embryos to 68.0±2.3 A.U. (n=24; P=3.0×10⁻⁹), a 62% increase in length. Values are average ± s.e.m. The orientation of embryos is as in Fig. 1.
|
