
FIGURE
Fig. 2
Fig. 2
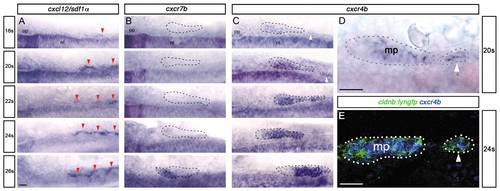
SPCs express Cxcr4b, but not Cxcr7b. (A-C) Time course of cxcl12/sdf1α (A), cxcr7b (B) and cxcr4b (C) expression at 18s-26s. Red arrowheads indicate sdf1α expression in somites; white arrowheads indicate cxcr4b expression in SPCs. The main primordium (18 and 20s) and primordium fused with SPCs (22 to 26s) are outlined with dashed lines. (D,E) High magnification views of cxcr4b expression at 20s (D) and cxcr4b (blue) in cldnb:lyngfp embryos (green) at 24s (E). Main primordium (mp) and SPCs are outlined. Scale bars: 25 μm. |
Expression Data
Expression Detail
Antibody Labeling
Phenotype Data
Phenotype Detail
Acknowledgments
This image is the copyrighted work of the attributed author or publisher, and
ZFIN has permission only to display this image to its users.
Additional permissions should be obtained from the applicable author or publisher of the image.
Full text @ Development