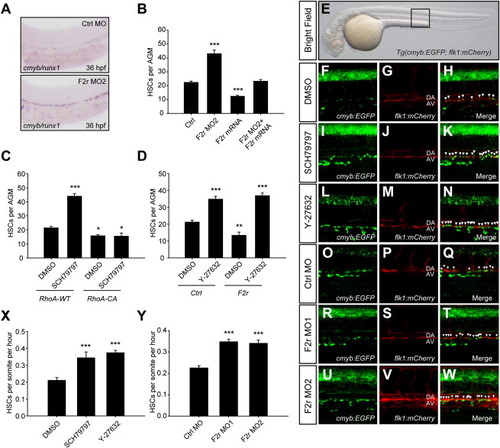
Inhibition of F2r-RhoA/ROCK Pathway Promotes EHT and HSC Induction In Vivo(A) WISH analyses of cmyb/runx1 expression at 36 hpf. A total of 4 ng Ctrl MO or F2r MO2 was injected at one-cell stage. The AGM regions were shown with the anterior to the left.(B) Quantification of cmyb/runx1-positive HSCs per AGM. A total of 4 ng F2r MO or 400 pg F2r mRNA was injected alone or in combination at one-cell stage. WISH analyses were performed at 36 hpf, followed by quantification (n e 5).(C and D) Epistasis analyses of F2r-RhoA/ROCK pathway in zebrafish. Embryos injected with 20 pg human RhoA WT or RhoA-CA (Q63L) mRNA, and treated with DMSO or 100 nM SCH79797 from 12 to 36 hpf (C). Embryos injected with 400 pg control or zebrafish F2r mRNA, and treated with DMSO or 10 μM Y-27632 from 12 to 36 hpf (D). Riboprobes to cmyb and runx1 were stained simultaneously at 36 hpf, followed by WISH quantification (n e 5).(E) Global view of the imaging position in Tg(cmyb:EGFP; flk1:mCherry) double-transgenic zebrafish. The square indicates the live-imaging position.(F–W) Time-lapse confocal microscopy analyses of in vivo EHT. Representative pictures were captured from Movie S1 after DMSO (F–H), 300 nM SCH79797 (I–K), or 10 μM Y-27632 treatments (L–N) starting at 12 hpf, and from Movie S2 after 4 ng Ctrl MO (O–Q), 4 ng F2r MO1 (R–T), or 4 ng F2r MO2 (U–W) injections. Multilayer confocal scanning was performed from 32 to 48 hpf, followed by z stack processing. DA, dorsal aorta; AV, axial vein. Arrowheads indicate cells that are undergoing EHT. Note that dorsal neurons are nonspecifically labeled in these embryos, whereas the cmyb+ cells under the AV were hematopoietic precursors.(X and Y) Statistical analyses of EHT frequency.Data shown are the mean ± SEM of at least three independent experiments. *p< 0.05, **p< 0.01, ***p< 0.001 versus the corresponding control. See also Figures S3 and S4 and Movies S1 and S2.
|
