
Fig. 2
- ID
- ZDB-FIG-120329-46
- Publication
- Royo et al., 2012 - Identification and Analysis of Conserved cis-Regulatory Regions of the MEIS1 Gene
- Other Figures
- All Figure Page
- Back to All Figure Page
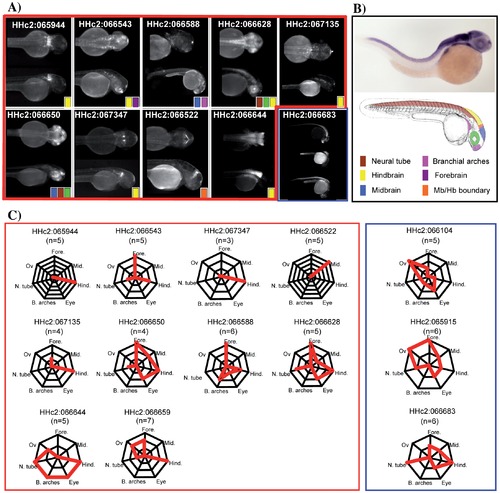
Enhancer activities from the HCNRs recapitulate endogenous meis1 expression pattern. A) Dorsal and lateral views of a representative founder illustrate the expression pattern of each HCNR. B) Picture of a meis1 in situ hybridization of a 30 hpf embryo illustrates the different expression territories. A color-based schema of a zebrafish embryo highlights the different domains where GFP expression was found during the study. C) Diagrams of patterns of expressions of highly penetrant enhancers (boxed in red) and of non-tissue specific enhancers (boxed in blue). In each diagram, the number of founder lines showing expression in each particular body structure is represented by the red lines. For example, of three lines of HHc2:066543, all three showed forebrain expression, and additionally, two of them drove expression in the hindbrain while the remaining one in the neural tube. In situ hybridization picture is from ZFIN [16]. |
| Gene: | |
|---|---|
| Fish: | |
| Anatomical Terms: | |
| Stage: | Prim-15 |