
Fig. 5
- ID
- ZDB-FIG-111115-5
- Publication
- Lister et al., 2011 - Embryonic expression of zebrafish MiT family genes tfe3b, tfeb, and tfec
- Other Figures
- All Figure Page
- Back to All Figure Page
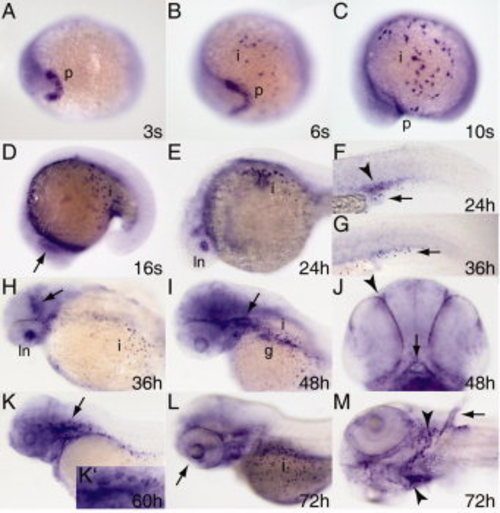
Expression pattern of tfe3b during embryogenesis. Whole mount RNA in situ hybridization was performed on embryos at the stages indicated. A–C: Expression begins in the polster (A,B) and is seen shortly thereafter in ionocytes (B,C). D,E,H: Expression is observed in the lens placode at the 16-somite stage (D, arrow), and thereafter (up to 36 hours postfertilization [hpf]) in the lens itself (E,H). F,G: Expression in the intermediate cell mass (arrowhead, F) is seen at 24 hpf but has disappeared by 36 hpf (G; arrows indicate ionocytes). H,I: tfe3b is expressed at the mid-hindbrain boundary at 36 hpf (arrow, H) and in the otic epithelium (arrow, I) as well as gut tissue and ionocytes, and more diffusely through the head at 48 hpf. J: Expression is also seen in the olfactory pits (arrowhead) and mouth (arrow) at this stage. K: At 60 hpf, tfe3b is expressed in the epithelial protrusions of the dorsal otocyst (arrow; K2, higher magnification). L: Ciliary margin expression (arrow). M: Expression in ionocytes associated with the branchial arches (arrowheads) and in pectoral fin cartilage (arrow). All views lateral except A,B,J, ventral view; H,I, dorsolateral view; M, ventrolateral view. Abbreviations: p, polster; i, ionocytes; ln, lens; g, gut. |
| Gene: | |
|---|---|
| Fish: | |
| Anatomical Terms: | |
| Stage Range: | 1-4 somites to Protruding-mouth |