
Fig. 5
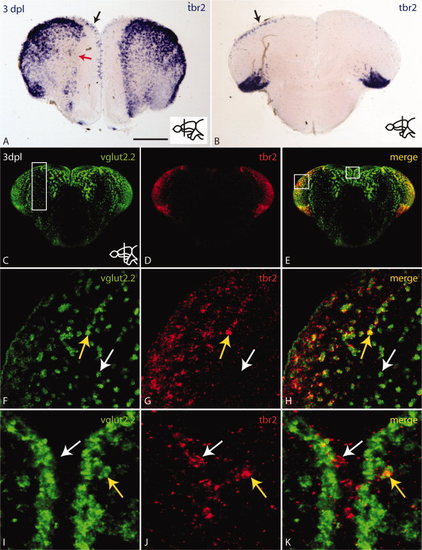
The number of tbr2 positive cells is increased in the injured hemisphere in response to stab injury. A,B: In situ hybridization with tbr2 antisense probe on cross-sections shows an increase of tbr2 expressing cells in the injured hemisphere at anterior (A) and posterior levels (B) (black arrows). Red arrow in A indicates loss of tbr2 expression probably due to the loss of neurons as a result of the lesion. C–E: Overview of double fluorescent in situ hybridization for vglut2.2 (C) and tbr2 (D) and merged channels (E) at 3 dpl. tbr2 and vglut2.2 are co-expressed in the dorsolateral pallium. White box in C indicates region of injury. White boxes in E indicate high magnification views in F–H (left box) and I–K (middle box). F–H: High magnification of the left box in E. The yellow arrow indicates co-expression of vglut2.2 and tbr2 whereas the white arrow points to a vglut2.2-positive/tbr2-negative cell. I–K: High magnification of the middle box in E. The yellow arrow indicates co-expression of vglut2.2 and tbr2 in a subventricular location whereas the white arrow points to a tbr2-positive/vglut2.2-negative cell at the ventricle. tbr2 is expressed in a subpopulation of glutamatergic neurons and potential glutamatergic progenitor cells at the ventricle. Scale bar = 100 μm in A,B; 150 μm in C–E; 30 μm in F–H; 15 μm in I–K. |