
Fig. 3
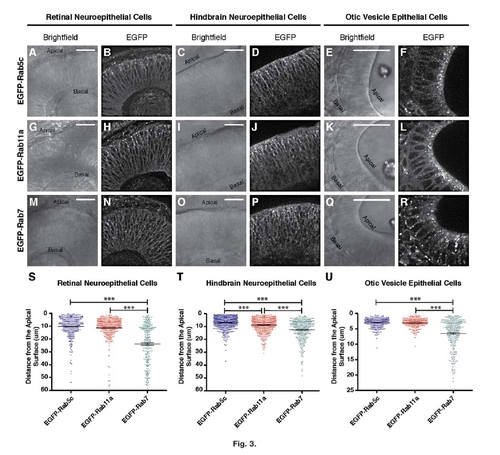
Expression and polarization of EGFP-Rab fusion proteins in neuroepithelial cells. Representative single-plane, confocal images of 28hpf embryos expressing (A–F) EGFP-Rab5c, (G–L) EGFP-Rab11a, or (M–R) EGFP-Rab7. Distinct fluorescent endosomes can be visualized as bright structures above a general membrane background in B, D, F, H, J, L, N, P, and R. Bright-field images (A, C, E, G, I, K, M, O, and Q) illustrate the structure of the developing epithelium with apical and basal surfaces indicated. Scale bars = 25 µm;. Asterisk in E, K, and Q indicates the presence of the anterior otolith. S–U: Quantification of endosome distance from the apical surface in (S) retinal neuroepithelial cells, and (T) hindbrain epithelial cells, (U) otic vesicle epithelial cells. In each cell type, EGFP-Rab5c, and EGFP-Rab11a, polarization is more towards the apical surface than EGFP-Rab7-positive endosomes. N>200 endosomes from images of 10 embryos across multiple clutches for each genotype and cell type. Mean distance from the apical surface is indicated with error bars indicating SEM. One-way ANOVA results indicate P < 0. 0001 for each cell type, followed by the Tukey′s post-test with ***P < 0.001. |
| Gene: | |
|---|---|
| Fish: | |
| Anatomical Terms: | |
| Stage: | Prim-5 |