
Fig. 2
- ID
- ZDB-FIG-111021-9
- Publication
- Huang et al., 2011 - Imaging of zebrafish in vivo with second-harmonic generation reveals shortened sarcomeres associated with myopathy induced by statin
- Other Figures
- All Figure Page
- Back to All Figure Page
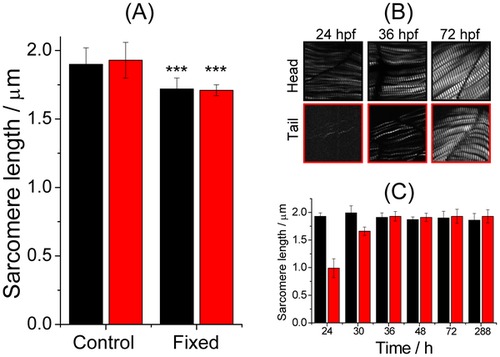
Sarcomeric length of living and fixed zebrafish, and developing larva at different stages. (A) Comparison of length of sarcomeres determined from zebrafish living and fixed with paraformaldehyde. The SHG images used to measure the lengths were measured on somites near the head (black, somites 5–8) and the tail (red, somites 21–24). The statistics were calculated based on 21 images obtained from three 72-hpf zebrafish. (B) Representative SHG images of zebrafish measured at three developmental stages (24, 36 and 72 hpf). The images were measured on regions near the head (somites 5~8) and the tail (somites 21–24). (C) Growth of the sarcomere from 1 to 12 dpf. The SHG images used to evaluate the length were measured on somites near the head (black, somites 5~8) and the tail (red, somites 21–24). The statistics were calculated based on 21 images obtained from three 72-hpf zebrafish. |