
Fig. 1
- ID
- ZDB-FIG-111021-8
- Publication
- Huang et al., 2011 - Imaging of zebrafish in vivo with second-harmonic generation reveals shortened sarcomeres associated with myopathy induced by statin
- Other Figures
- All Figure Page
- Back to All Figure Page
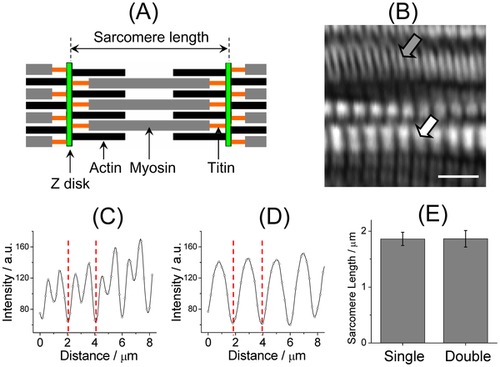
Sarcomeric length determined with SHG imaging. (A) A cartoon illustration of a sarcomere and the architectural arrangement of its major constituent filaments. The length of a sarcomere is defined as the separation between two z-disks. (B) A high-resolution SHG image of zebrafish muscles. The image exhibits two characteristic patterns that are denoted as double (gray arrow) and single bands (white arrow), respectively. Scale bar: 5 μm. (C, D) Representative cross-sectional plots of a double band (C) and a single band (D). The length of the sarcomere was determined from the distance between the two dashed lines as shown in the two cross-sectional plots. (E) Comparison of the averaged length of the sarcomere determined from the two sarcomeric patterns. The statistics were calculated based on 12 images obtained from somites near the head (fifth to eighth somite) of three 72-hpf zebrafish. |