
Fig. S3
- ID
- ZDB-FIG-110915-17
- Publication
- Zygmunt et al., 2011 - Semaphorin-PlexinD1 Signaling Limits Angiogenic Potential via the VEGF Decoy Receptor sFlt1
- Other Figures
- All Figure Page
- Back to All Figure Page
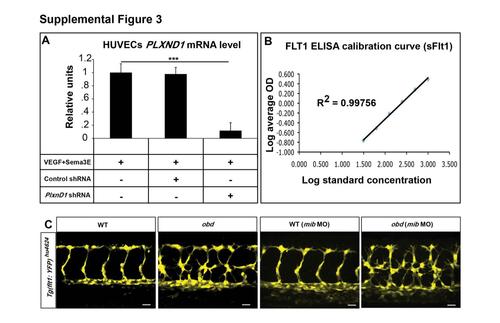
Related to Figure 3. PLXND1 mRNA Levels in HUVECs under Different Conditions, Experimental Controls for Flt1 ELISA and Expression of the flt1 Transcriptional Reporter Tg(flt1:YFP)hu4624 in WT and obd (A) Validation of shRNA-mediated PLXND1 knockdown. qPCR measurements of PLXND1 mRNA abundance in HUVECs treated with VEGF and Sema3E and infected with the indicated control or PLXND1-targeting shRNA lentiviral particles. ***p < 0.001. Error bars, s.e.m. (B) Standard calibration curve generated for the ELISA-based quantification of Flt1 made by HUVECs based on average optical density (OD) at various concentrations. Coefficient of determination, R2 = 0.99756. Error bars, s.e.m. (C) Expression of the Tg(flt1:YFP)hu4624 reporter in WT and obd with or without 10 ng of mib morpholino (mib MO). n = 10 for WT, n = 12 for obd, n = 11 for WT (mib MO) and n = 9 for obd (mib MO). |
Reprinted from Developmental Cell, 21(2), Zygmunt, T., Gay, C.M., Blondelle, J., Singh, M.K., Flaherty, K.M., Means, P.C., Herwig, L., Krudewig, A., Belting, H.G., Affolter, M., Epstein, J.A., and Torres-Vazquez, J., Semaphorin-PlexinD1 Signaling Limits Angiogenic Potential via the VEGF Decoy Receptor sFlt1, 301-314, Copyright (2011) with permission from Elsevier. Full text @ Dev. Cell