
Fig. 1
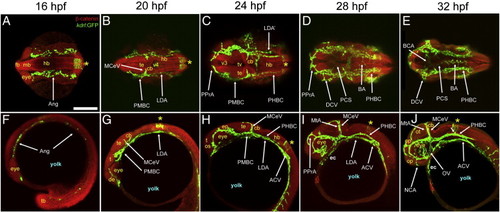
Overview of vascular development in the head and brain (16–32 hpf). A-J, Maximum intensity confocal projections of immuno-fluorescently stained embryos carrying the endothelial reporter Tg(kdrl:GFP)1a116. Endothelium, green (GFP). Cell outlines, red (β-catenin). Ages (hpf) indicated on top. Abbreviations (see Table 1):vasculature, white (apostrophe, right side). Neuroepithelium, yellow. Other structures, blue. Small white arrows, CtAs. Yellow asterisk, r5 GFP-positive neuroepithelial signal from the Tg(kdrl:GFP)1a116 reporter. A-E, Dorsal views (ventral level). Anterior, left. Left side, bottom. F-J, Left lateral views. Anterior, left. Dorsal, up. Scale bar (A), 200 μm. |
| Gene: | |
|---|---|
| Fish: | |
| Anatomical Terms: | |
| Stage Range: | 14-19 somites to Prim-15 |
Reprinted from Developmental Biology, 357(1), Ulrich, F., Ma, L.H., Baker, R.G., and Torres-Vazquez, J., Neurovascular development in the embryonic zebrafish hindbrain, 134-51, Copyright (2011) with permission from Elsevier. Full text @ Dev. Biol.