
Fig. 3
- ID
- ZDB-FIG-110720-51
- Publication
- Simões et al., 2011 - Fgf differentially controls cross-antagonism between cardiac and haemangioblast regulators
- Other Figures
- All Figure Page
- Back to All Figure Page
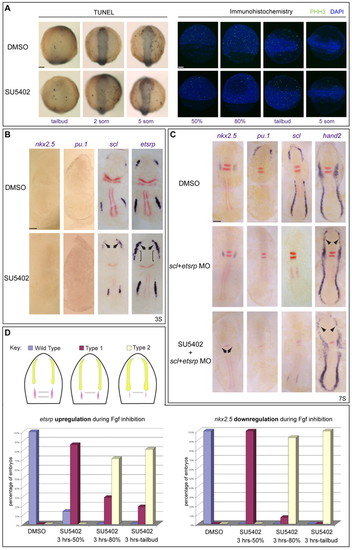
Fgf induces cardiac specification independently of, but concomitant with, haemangioblast repression. (A) Neither apoptosis nor proliferation is increased in SU5402-treated zebrafish embryos. Neither TUNEL nor phospho-histone-H3 (PHH3, green) staining increased in Fgf-depleted embryos during gastrulation or at the 5-somite (5 som) stage. Nuclei are stained with DAPI (blue). (B) Fgf inhibition of haemangioblast gene expression precedes nkx2.5 expression. When Fgf was reduced, the haemangioblast programme was upregulated in the anterior lateral plate mesoderm (ALPM) before the onset of nkx2.5 expression. Embryos were treated from 3 hpf with SU5402 and RNA expression was assayed at the 3-somite stage. No differences were observed for nkx2.5 or pu.1, compared with DMSO-treated embryos, but scl and etsrp were upregulated in the ALPM (arrows). etsrp was also ectopically expressed in adjacent mesoderm (brackets). (C) scl and etsrp morpholino (MO) co-injection led to severe downregulation of anterior haemangioblast gene expression (pu.1 and scl) with associated rostral expansion of cardiac hand2 expression (arrowheads). nkx2.5 expression was unchanged at this stage but, when Fgf signals were also deficient in scl/etsrp double morphants (SU5402 + scl+etsrp MO), nkx2.5 expression was absent (arrows). Downregulation of hand2 expression in the cardiac region was also seen; however, rostral expression was still observed (arrowheads). (D) Fgf signalling is required concomitantly for the establishment of cardiac and haemangioblast fates. Fgf was inhibited for different periods of time and expression of etsrp and nkx2.5 assessed by in situ hybridisation at the 7-somite stage. Phenotypes were categorised as wild type (blue), type 1 (purple) or type 2 (yellow) (see inset key diagram), where type 1 represents downregulation of nkx2.5 with associated expansion of etsrp, and type 2 embryos show strong downregulation or absence of nkx2.5 and coupled expansion and upregulation of etsrp. Percentages of embryos showing increased etsrp or decreased nkx2.5 expression are shown. The experiment was repeated three times for 10 μM treatments and a representative experiment is shown, n>70 for each experimental point. Images show flat-mounted embryos, anterior to the top. Double-staining for myoD and krox20 (red) was used for staging and orientation. Scale bars: 100 μm. |