
Fig. 7
- ID
- ZDB-FIG-110622-52
- Publication
- Takahashi et al., 2011 - An Enzymatic Mechanism for Generating the Precursor of Endogenous 13-cis Retinoic Acid in the Brain
- Other Figures
- All Figure Page
- Back to All Figure Page
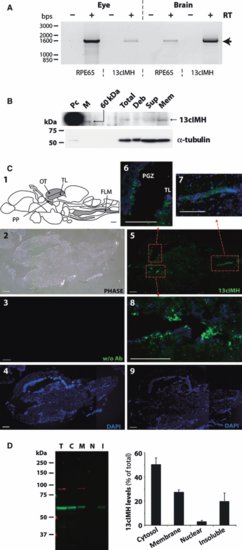
Localization of zebrafish 13cIMH in the brain and eye. (A) RT-PCR analysis of RPE65 and 13cIMH using RNA from the zebrafish eye and brain. RT-PCR was performed in the absence (-) and presence (+) of RT to exclude possible genomic DNA contamination. The arrow indicates the expected product size of 1.6 kb. (B) Western blot analysis of endogenous 13cIMH in the total membrane fraction of the brain. Cellular proteins (2.5 μg) of 293A-LRAT cells expressing 13cIMH were used as a positive control (Pc). Equal amounts (50 μg) of total zebrafish brain homogenates (Total), unbroken cell debris (Deb), supernatants following centrifugation (Sup) and total membrane fraction (Mem) were resolved by 8% SDS/PAGE and transferred onto the membrane. The endogenous 13cIMH expression was confirmed by western blot analysis (upper panel), and then the membrane was stripped and reblotted with an antibody for tublin (Abcam; lower panel). (C) Immunohisotochemistry of 13cIMH in the zebrafish brain. (C1) The diagram shows a drawing sagittal section of zebrafish brain (modified from Rupp et al. [36]). Gray-colored regions indicate the stained areas by immunohistochemistry. PP, periventricular pretectum; FLM, fasciculus longitudinalis medialis. (C2) A phase contrast image of a sagittal section of zebrafish brain. (C3, 4) The brain section was incubated without the primary antibody for 13cIMH (C3; FITC channel, c4; DAPI). (C5–9) The brain section was incubated with the primary antibody for 13cIMH. Green fluorescence indicated the signals of 13cIMH at low magnification (C5; 13cIMH and c9; DAPI) and at high magnification from the boxed areas in c5: torus longitudinalis (TL) (C6–8). Scale bar = 200 μm. (D) Subcellular localization of 13cIMH in cultured cells. Forty-eight hours post-transfection of the 13cIMH plasmid, the cells were harvested and separated into four subcellular fractions by the FractionPrep™ kit (BioVision, Mountain View, CA, USA). Equal amounts of fractionated proteins (25 μg for total protein, 5 μg each fraction) were employed for western blot analyses using anti-13cIMH serum. T, total cell lysates; C, cytosolic; M, membrane; N, nuclear fractions; I, detergent-insoluble fraction. The level of 13cIMH in each fraction was quantified by densitometry and expressed as the percentage of total 13cIMH (mean ± SEM) from four independent experiments. |
| Gene: | |
|---|---|
| Fish: | |
| Anatomical Terms: | |
| Stage: | Adult |