
Fig. 2
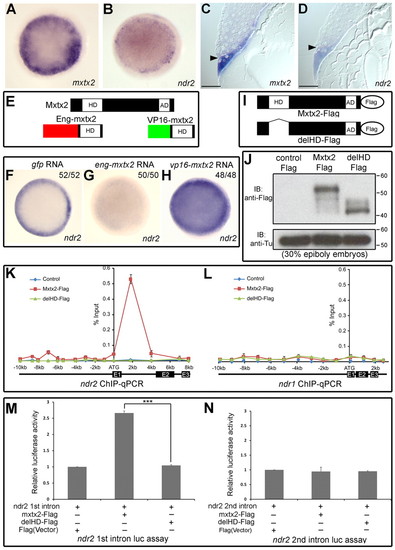
Mxtx2 activates ndr2 directly. (A-D) mxtx2/ndr2 co-expression at oblong (A,B; 3.7 hpf; animal pole views) and 30% epiboly (4.7 hpf; C,D, histological sections through margin and YSL) stages. Scale bars: 50 μm. Arrowheads (C,D) indicate the margin-YSL boundary. (E) Mxtx2 protein and derivative constructs. HD, homeodomain; AD, acidic domain. (F-H) Injection of 25 pg eng-mxtx2 or 25 pg vp16-mxtx2 mRNA alters ndr2 expression; 30% epiboly stage (4.7 hpf), animal pole views. Fractions indicate the number of equivalent outcomes/number of embryos observed. (I,J) Structure (I) and western blots showing expression (J) of tagged Mxtx2 (Mxtx2-Flag) and negative control (delHD-Flag) constructs. (K,L) Increased ChIP-qPCR signal for ndr2 intron 1, but not ndr1, in embryos injected with 25 pg mxtx2-flag mRNA. x-axes show positions of primers (see Table S1 in the supplementary material) relative to the three exons (E1-E3, black boxes) of ndr2 and ndr1. y-axes show percentage immunoprecipitated DNA relative to input DNA (see Materials and methods). Error bars indicate 1 s.d. based on two trials. (M,N) Increase in luciferase activity derived from a construct carrying ndr2 intron 1 (M), but not from a construct carrying ndr2 intron 2 (N), after co-transfection with an Mxtx2 expression vector. ***, P<0.0001; t-test. Error bars indicate 1 s.d. based on three trials. |