
Fig. 6
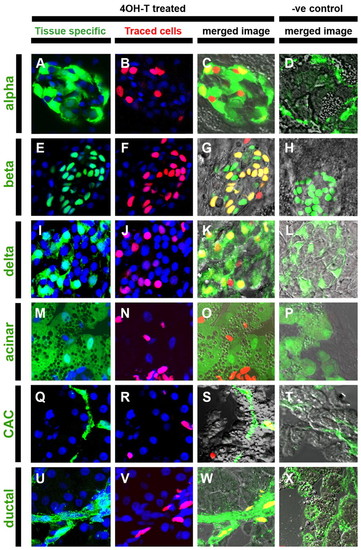
Adult pancreatic endocrine, ductal and centroacinar cells are derived from larval Notch-responsive progenitors. GIFM larvae (56 hpf) were treated with 4OHT (4OHT treated) or vehicle alone (–ve control) for 24 hours and raised to juvenile stages (55 dpf) before pancreata were removed and cryosectioned. (A-X) Confocal images (single optic sections) from sectioned pancreata. (A,E,I,M,Q) Tissue-specific transgenes or (U) immunofluorescence-labeled pancreas cell types in green (tissue specific). Transgenic lines used to mark specific adult tissues: (A-D) gcga:GFP marks α-cells (alpha), (E-H) ins:hmgb1-eGFP marks β-cells (beta), (I-L) SST2:eGFP marks δ-cells (delta), (M-P) ptf1a:eGFP marks acinar tissue (acinar) and (Q-T) Tp1:eGFP marks centroacinar cells (CAC) (note GFP signal in Tp1:eGFP sections is detected by immunofluorescence). (U-X) Immunofluorescent staining was used to detect the ductal marker cytokeratin 18 (ductal). In images of `tissue specific′ marked cells and `traced cells′, nuclei are stained blue with DAPI. Merged images include bright-field views to aid discernment of cellular morphology. (B,F,J,N,R,V) The progeny of fate-mapped PNCs are labeled red (traced cells). (C,G,K,O,S) Fate-mapped PNC progeny contributing to pancreas cells marked by tissue-specific transgene or (W) immunofluorescence result in double-labeled cells that appear yellow in merged images (merged image). Width of each panel represents 50 μm. |