
Fig. 7
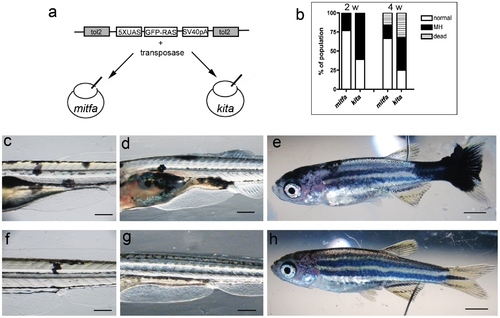
Comparison between mitfa and kita Gal4 driver lines. a) Schematic diagram of the construct and injection strategy used to transiently express GFP-HRASV12 in the mitfa:Gal4 and kita:Gal4 lines. b) Percentage of injected fish that display melanoytic hyperplasia/melanoma (MH) at 2 and 4 weeks (w) post fertilization. c–e) 4, 14 and 32dpf kita-Gal4 fish injected with UAS-GFP-HRASV12 plasmid for somatic integration. Mosaic expression of the transgene leads to abnormal melanocytes (c), persistent melanocytic hyperplasia (d) and melanoma (e) f–h) 4, 14 and 32dpf mitfa-Gal4 fish injected with UAS-GFP-HRASV12 plasmid. Mosaic expression of the transgene in this driver line generates fewer and smaller melanocytic lesions. Calibration bars = 2 mm. |