
FIGURE
Fig. S1
- ID
- ZDB-FIG-101122-61
- Publication
- Ozbudak et al., 2010 - Spatiotemporal compartmentalization of key physiological processes during muscle precursor differentiation
- Other Figures
- All Figure Page
- Back to All Figure Page
Fig. S1
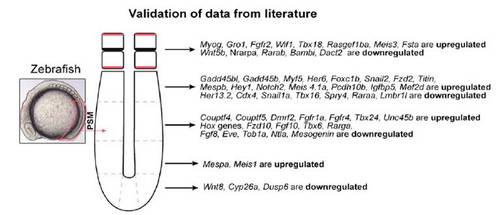
Validation of data from the literature. Genes are marked, depending after which spatial point their levels are significantly increased or decreased (compared with the initial time point; tail bud) with 10% false-discovery rate and 1.5-fold change. The results can be compared with those from the ZFIN database online (http://zfin.org/cgi-bin/webdriver?MIval=aa-xpatselect.apg). |
Expression Data
Expression Detail
Antibody Labeling
Phenotype Data
Phenotype Detail
Acknowledgments
This image is the copyrighted work of the attributed author or publisher, and
ZFIN has permission only to display this image to its users.
Additional permissions should be obtained from the applicable author or publisher of the image.
Full text @ Proc. Natl. Acad. Sci. USA