
Fig. 1
- ID
- ZDB-FIG-101122-12
- Publication
- Appelbaum et al., 2009 - Sleep-wake regulation and hypocretin-melatonin interaction in zebrafish
- Other Figures
- All Figure Page
- Back to All Figure Page
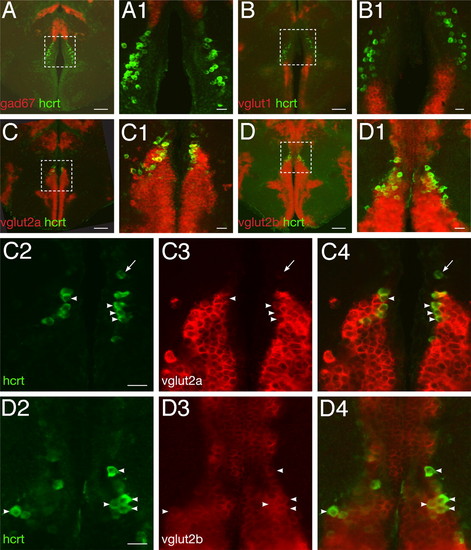
Zebrafish HCRT neurons are glutamatergic. (A–D) and close-ups (A1–D1) Double fluorescent ISH between hcrt mRNA and fast neurotransmitter phenotype markers as visualized using confocal microscopy on adult brain sections (reconstructed stacks of 0.5- or 1-μm sections). (C2–C4) and (D2–D4): single-plane, high-magnification pictures of hcrt cells (green, C2, D2), vglut2a or -b cells (red, C3, D3), and merged views (C4, D4). Arrowheads indicate cells coexpressing hcrt and vglut2a or vglut2b. Note the frequent colocalization. Absence of coexpression is occasionally observed (arrow). [Scale bar, 100 μm (A–D), 20 μm (A1–D1, C2–C4, and D2–D4).] |
| Genes: | |
|---|---|
| Fish: | |
| Anatomical Terms: | |
| Stage: | Adult |