
Fig. S6
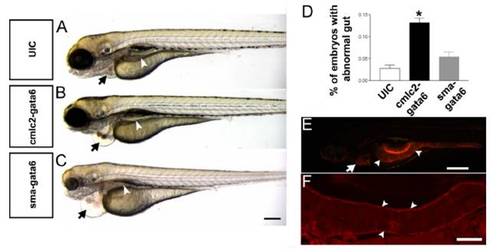
Characterization of tissue-specific gata6 overexpression on development. (A–C) Pericardial edema (black arrow) results from injection of either SMA:Gata6 or CMLC2:Gata6, but only SMA:Gata6-injected embryos show an abnormal gut tube (white arrowhead) at 96 hpf. (D) The percentage of embryos exhibiting the abnormal gut morphology was analyzed by using Student’s t test (P < 0.05). A significantly higher percentage of embryos with abnormal gut development is found in SMA:Gata6 injected embryos. Bars,mean±SEM. *, P<0.05 (n>50 per group). (E) Lateral view of a control Tg (SMA: mCherry) transgenic embryo at 96 hpf. The heart (white arrow) and gut smooth muscle (white arrowheads) show expression of mCherry. (F) Longitudinal section of a 96 hpf Tg (SMA: mCherry) embryo shows that mCherry is specifically expressed in visceral smooth muscle cells (white arrowheads). (Scale bars, C: 200 μm; E: 400 μm; F: 50 μm.) |