
FIGURE
Fig. 7
- ID
- ZDB-FIG-101008-4
- Publication
- Boehmler et al., 2004 - Evolution and expression of D2 and D3 dopamine receptor genes in zebrafish
- Other Figures
- All Figure Page
- Back to All Figure Page
Fig. 7
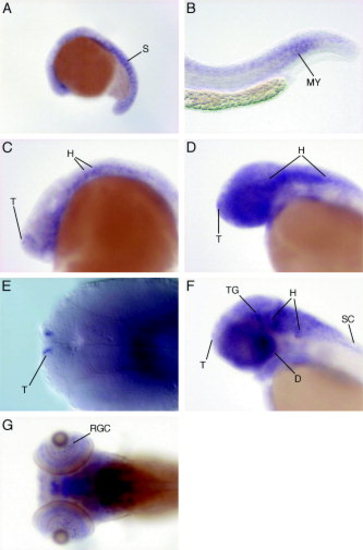
Expression of the dopamine receptor D3 gene drd3. A–D: Lateral views of embryos at mid-somitogenesis (A), 24 hours postfertilization (hpf; tail, B), 24 hpf (head, C), and 36 hpf (D). E: Differential interference contrast microscopy (DIC) image at 36 hpf. F: At 48 hpf (lateral view). G: At 5 dpf (dorsal view). D, diencephalon; H, hindbrain; MY, myotomes; RGC, retinal ganglion cell layer; S, somites; SC, spinal cord; T, telencephalon; TG, tegmentum. |
Expression Data
| Gene: | |
|---|---|
| Fish: | |
| Anatomical Terms: | |
| Stage Range: | 14-19 somites to Day 5 |
Expression Detail
Antibody Labeling
Phenotype Data
Phenotype Detail
Acknowledgments
This image is the copyrighted work of the attributed author or publisher, and
ZFIN has permission only to display this image to its users.
Additional permissions should be obtained from the applicable author or publisher of the image.
Full text @ Dev. Dyn.