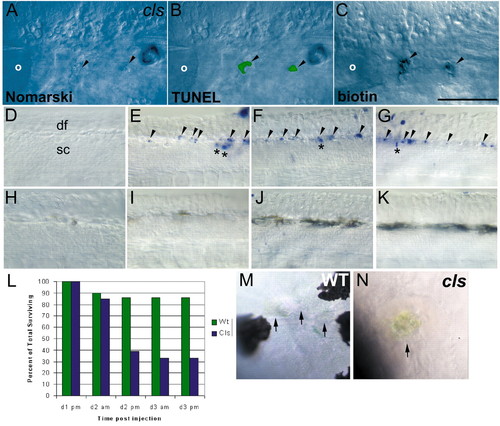
NCC death in cls embryos. (A-C) NCC clones die by an apoptotic mechanism in cls embryos. Lateral views of 40 hpf cls embryo in which two daughters of a single labelled NCC contributed to the posterior lateral line ganglion, lying just posterior to the otic vesicle (o). In the live embryo, both cells show blebbed morphology typical of apoptotic cells when viewed with Nomarski optics (A). After fixation and processing for TUNEL (B) and detection of the biotinylated-dextran lineage-tracer (C), visible TUNEL signal of these clonal cells indicates DNA fragmentation characteristic of apoptotic cells. (D-K) Whole-mount TUNEL shows NCC apoptosis in cls embryos. Lateral views of dorsal spinal cord (sc) in tail of 30 (D,H), 35 (E,I), 40 (F,J) and 45 (G,K) hpf embryos show apoptotic NCCs immediately dorsal to the spinal cord from 35 hpf in cls (arrowheads, D-G), but not wild-type (H-K), embryos. Scattered TUNEL-positive cells are prominent in dorsal spinal cord (*) of cls embryos (E-G); these are occasionally seen in wild-type siblings at these stages (data not shown). df, dorsal fin. (L) Time-course of labelled single cranial NCC clone survival in cls mutants and their wild-type siblings. Percentage of surviving clones is given at each of the five standard time points when embryos were examined. The time points correspond to approximately 16, 32, 40, 56 and 64 hpf, respectively. The first time point includes only single labelled NCCs based on examination within a few hours after labelling. See text for further details. (M,N) Wild-type xanthophores (arrows) at 48 hpf have a very flattened, thin morphology and are only weakly coloured (M), while a dying cls xanthophore (arrow) shows characteristic apoptotic morphology and concentrated yellow coloration, which was usually visible by 35 hpf (N). Scale bar: 100 μm in A-C; 50 μm in D-K; 75 μm in M,N.
|
