
FIGURE
Fig. 7
- ID
- ZDB-FIG-100903-9
- Publication
- Liu et al., 2010 - The evolution of somatostatin in vertebrates
- Other Figures
- All Figure Page
- Back to All Figure Page
Fig. 7
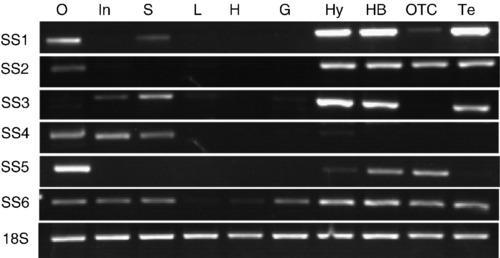
RT-PCR analysis of tissue expression patterns of SS1, SS2, SS3, SS4, SS5 and SS6 in zebrafish. 18S was used as the housekeeping gene control. Te: telencephalon; OTT: optic tectum thalamus; HB, hindbrain; Hy: hypothalamus; Gi: gill; H: heart; L: liver; S: spleen; In: intestine; O: ovary. |
Expression Data
| Genes: | |
|---|---|
| Fish: | |
| Anatomical Terms: | |
| Stage: | Adult |
Expression Detail
Antibody Labeling
Phenotype Data
Phenotype Detail
Acknowledgments
This image is the copyrighted work of the attributed author or publisher, and
ZFIN has permission only to display this image to its users.
Additional permissions should be obtained from the applicable author or publisher of the image.
Reprinted from Gene, 463(1-2), Liu, Y., Lu, D., Zhang, Y., Li, S., Liu, X., and Lin, H., The evolution of somatostatin in vertebrates, 21-28, Copyright (2010) with permission from Elsevier. Full text @ Gene