
Fig. 5
- ID
- ZDB-FIG-100723-35
- Publication
- Freisinger et al., 2010 - Regulator of g protein signaling 3 modulates wnt5b calcium dynamics and somite patterning
- Other Figures
- All Figure Page
- Back to All Figure Page
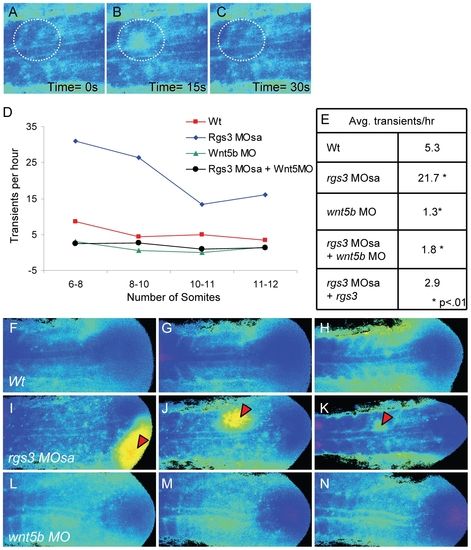
rgs3 impacts segmentation stage Ca2+ dynamics. Zebrafish embryos injected with Fura-2 were oriented in a dorsal posterior view. Representative ratio images, pseudocolored with low Ca2+ represented by blue, and high Ca2+ represented by yellow/red (A–C,F–N). During somitogenesis, Ca2+ transients are identified as a local short-lived increase in intracellular Ca2+ levels. A region of interest (ROI) is noted by a dashed circle highlighting a representative Ca2+ transient (A–C). In the ROI from time 0s to time 15s, an increase in Ca2+ levels is observed (B) that subsides by time 30s (C). The number of transients as a function of developmental age (D). Table depicting the average number of Ca2+ transients per hour from 6 to 12 somite stage for each treatment (E). Representative ratio images of 5 somite stage (F), 7 somite (G) and 10 somite stage (H) wt embryos taken from Video S1. Representative ratio images of 5 somite (I), 7 somite (J) and 10 somite stage (K) rgs3 MOsa injected embryo taken from Video S2. Representative ratio images of 5 somite (L), 7 somite stage (M) and 10 somite stage (N) wnt5b MO injected embryo taken from Video S4. Red arrowheads indicate large Ca2+ transients in rgs3 morphant embryos (I–K) that are not observed in wt (F–H) or wnt5b morphant embryos (L–N). |
| Fish: | |
|---|---|
| Knockdown Reagents: | |
| Observed In: | |
| Stage Range: | 5-9 somites to 10-13 somites |