
FIGURE
Fig. S4
Fig. S4
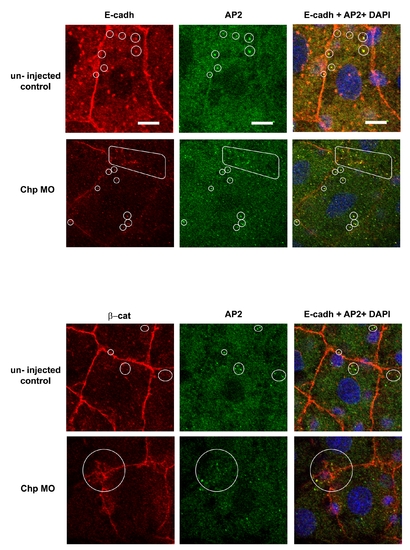
A portion of E-cadh co-localizes with intracellular AP-2 vesicles. Confocal images (zoomed) of E-cadh with AP-2 in EVL cells. The un-injected controls and Chp MO2 injected embryos are compared. The image is a single confocal slice of 0.5 μm step size. The loss of the Chp signal leads to E-cadh depletion from AJs and becoming associated primarily with intracellular AP-2 vesicles clustered near the AJs. Scale bars represent 20 μm. |
Expression Data
Expression Detail
Antibody Labeling
Phenotype Data
Phenotype Detail
Acknowledgments
This image is the copyrighted work of the attributed author or publisher, and
ZFIN has permission only to display this image to its users.
Additional permissions should be obtained from the applicable author or publisher of the image.
Full text @ PLoS One