
Fig. 6
- ID
- ZDB-FIG-100429-83
- Publication
- van Eekelen et al., 2010 - RPTPalpha and PTPepsilon Signaling via Fyn/Yes and RhoA is Essential for Zebrafish Convergence and Extension Cell Movements during Gastrulation
- Other Figures
- All Figure Page
- Back to All Figure Page
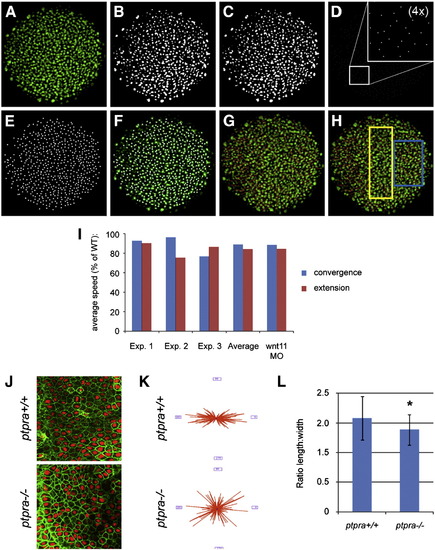
Decreased convergence and extension cell migration speed and cell intercalation in ptpra-/- mutant. Image processing used for cell tracking in order to quantify migration speeds: (A) original single Z-slice image acquired by confocal imaging of a wildtype embryo micro-injected with fluorescently labeled Histone 1 protein, (B) binary image, (C) binary image processed by watershedding, (D) all objects are eroded to a single pixel (inset shows 4x magnification for clarity), (E) every pixel is dilated, (F) projection of the resulting objects used for tracing onto the original image, (G) tracks generated by tracking algorithm projected onto the original image, (H) tracks generated by tracking algorithm projected onto the original image; the yellow rectangle indicates the area where tracks for extension speeds are collected, the blue rectangle represents the area where tracks for convergence speeds are collected. (I) Ptpra+/- fish were in-crossed and embryos were injected with Alexa Histone 1. Subsequently, 4–6 embryos were imaged in parallel using confocal microscopy starting from shield stage. Images were processed as described above and average cell migration speed was calculated by dividing the track length by the number of frames. For every experiment the average speed was calculated in either the convergence or the extension direction for typically more than 1000 cells per embryo. The embryos were subsequently genotyped and the average convergence and extension speeds in ptpra-/- mutant embryos were plotted as a percentage of the average speeds in wildtype siblings for every experiment individually. The average of the 3 experiments is indicated as well. As a positive control, convergence and extension speed was determined in wnt11 knockdown embryos, that are well known to have convergence and extension cell movement defects. The average reduction determined in 3 independent experiments is shown. (J) Ptpra+/- fish were in-crossed and embryos were injected with YFP-CAAX and H2A-mCherry RNA. Embryos were mounted and imaged at late gastrulation stage posterior of the future site of the first somite in the region next to the notochord. After imaging embryos were genotyped. Shown are mutant and wildtype embryos. Obtained images were processed and the angles of cells were determined using ImageJ software and Shape_Descriptor1u plugin (Syverud et al., 2007). Resulting angles are from 2 mutant embryos and 2 wildtype embryos and are plotted in a rose diagram (K). Length and width of the cells were determined in a similar fashion and the ratios were plotted (L). Mutants were compared to wildtype data using Student t-test, error bars represent standard deviation, asterisk indicates a P-value < 0.001. |
| Fish: | |
|---|---|
| Knockdown Reagent: | |
| Observed In: | |
| Stage Range: | Shield to 1-4 somites |
Reprinted from Developmental Biology, 340(2), van Eekelen, M., Runtuwene, V., Overvoorde, J., and den Hertog, J., RPTPalpha and PTPepsilon Signaling via Fyn/Yes and RhoA is Essential for Zebrafish Convergence and Extension Cell Movements during Gastrulation, 626-639, Copyright (2010) with permission from Elsevier. Full text @ Dev. Biol.