
Fig. 2
- ID
- ZDB-FIG-100223-36
- Publication
- Hultman et al., 2010 - Differential contribution of direct-developing and stem cell-derived melanocytes to the zebrafish larval pigment pattern
- Other Figures
- All Figure Page
- Back to All Figure Page
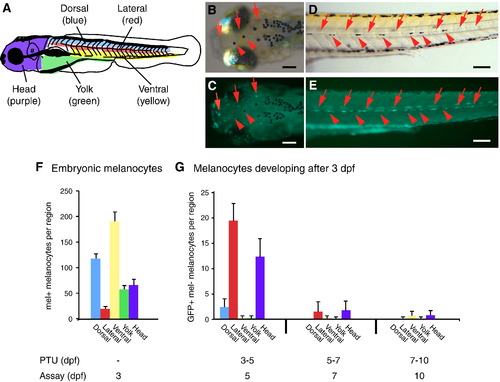
Location and time of differentiation of larval melanocytes. (A) Cartoon showing regions of embryonic and larval melanocyte quantitation. (B–E) Photos of Tg(Tyrp1:GFP)j900 larva at 5 dpf after treatment with PTU from 3 to 5 dpf showing melanocytes that differentiated prior to melanin inhibition by PTU (melanin+, GFP+, red arrowheads) and melanocytes that differentiated after melanin inhibition by PTU (melanin-, GFP+, red arrows). (B, C) Dorsal view of the head. (D, E) Lateral view showing the left-side lateral stripe. Additional, out-of-focus fluorescence is also apparent from melanocytes in the right-side horizontal myoseptum. (F) Quantitation of embryonic melanocytes in various regions at 3 dpf. Average number of melanized cells, error bars represent standard deviation, n = 10. (G) Quantitation of melanocytes that develop at 3–5 dpf, 5–7 dpf, and 7–10 dpf in these regions. Average number of GFP-positive, melanin-negative cells at time of assay, error bars represent standard deviation, n = 10. Scale bars, 100 μm. |
Reprinted from Developmental Biology, 337(2), Hultman, K.A., and Johnson, S.L., Differential contribution of direct-developing and stem cell-derived melanocytes to the zebrafish larval pigment pattern, 425-431, Copyright (2010) with permission from Elsevier. Full text @ Dev. Biol.