
Fig. 1
- ID
- ZDB-FIG-100209-1
- Publication
- Jung et al., 2010 - Visualization of myelination in GFP-transgenic zebrafish
- Other Figures
- All Figure Page
- Back to All Figure Page
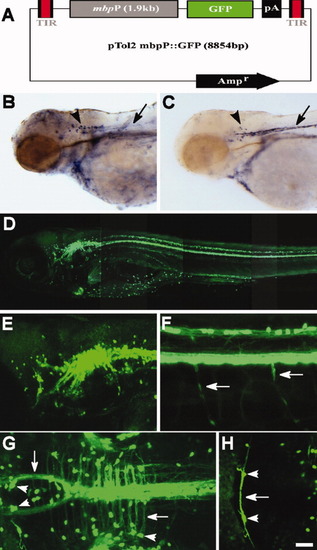
Enhanced green fluorescent protein (EGFP) expression in Tg(mbp:egfp) zebrafish. A: Structure of the pTol2mbp:gfp DNA to drive EGFP expression in oligodendrocytes. B,C: Expression of mbp in wild-type (wt; B) and of egfp in Tg(mbp:egfp) (C) embryos revealed by in situ RNA hybridization at 4 days postfertilization (dpf). Arrowheads and arrows indicate ventral hindbrain and lateral line Schwann cells, respectively. D-H: EGFP expression in 5 dpf Tg(mbp:egfp) zebrafish. D-F: Lateral views of the whole embryo (D), hindbrain (E), and spinal cord (F), dorsal to the top and anterior to the left. Arrows in F indicate EGFP+ Schwann cells. G,H: Dorsal views of the hindbrain, anterior to the left. EGFP expressions were detected in the cell bodies (arrowheads) and processes of oligodendrocytes (arrows). Scale bars = 75 μm in B,C, 100 μm in D, 50 μm in E,H, 25 μm in F,G. |