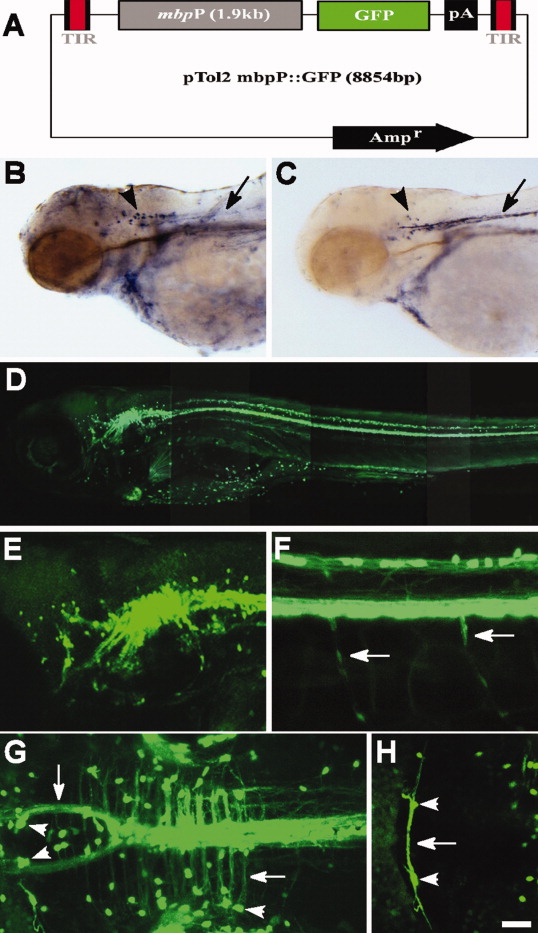
Fig. 1 Enhanced green fluorescent protein (EGFP) expression in Tg(mbp:egfp) zebrafish. A: Structure of the pTol2mbp:gfp DNA to drive EGFP expression in oligodendrocytes. B,C: Expression of mbp in wild-type (wt; B) and of egfp in Tg(mbp:egfp) (C) embryos revealed by in situ RNA hybridization at 4 days postfertilization (dpf). Arrowheads and arrows indicate ventral hindbrain and lateral line Schwann cells, respectively. D-H: EGFP expression in 5 dpf Tg(mbp:egfp) zebrafish. D-F: Lateral views of the whole embryo (D), hindbrain (E), and spinal cord (F), dorsal to the top and anterior to the left. Arrows in F indicate EGFP+ Schwann cells. G,H: Dorsal views of the hindbrain, anterior to the left. EGFP expressions were detected in the cell bodies (arrowheads) and processes of oligodendrocytes (arrows). Scale bars = 75 μm in B,C, 100 μm in D, 50 μm in E,H, 25 μm in F,G.
Image
Figure Caption
Acknowledgments
This image is the copyrighted work of the attributed author or publisher, and
ZFIN has permission only to display this image to its users.
Additional permissions should be obtained from the applicable author or publisher of the image.
Full text @ Dev. Dyn.

