
Fig. S8
- ID
- ZDB-FIG-091214-30
- Publication
- Picker et al., 2009 - Dynamic coupling of pattern formation and morphogenesis in the developing vertebrate retina
- Other Figures
- All Figure Page
- Back to All Figure Page
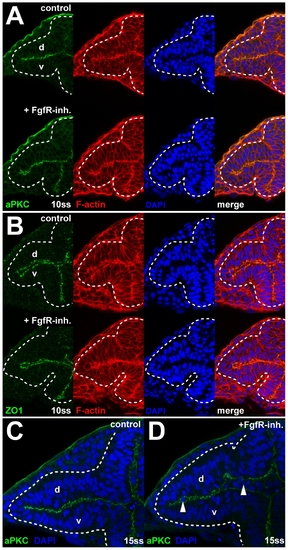
Apical-basal cell polarity after FgfR inhibition. (A and B) Normal localization of the apical membrane markers aPKC (A) and ZO1 (B) at 10ss, after FgfR-inh. treatment (bottom panels) compared to control embryos (top panels). (C and D) Cell delamination in the optic vesicle after FgfR-inh. treatment (D) compared to control (C) at 15ss. Sites of delamination (arrowheads in [D]) correspond to regions where apical membrane contact between dorsal and ventral leaflet (revealed by staining for aPKC, green) is lost. Images are transverse sections, counterstained with DAPI (blue) and for F-actin (red), dorsal to the top, dotted lines: neural tube boundary. d, dorsal optic vesicle leaflet; v, ventral optic vesicle leaflet. |