
Fig. S2
- ID
- ZDB-FIG-091214-25
- Publication
- Picker et al., 2009 - Dynamic coupling of pattern formation and morphogenesis in the developing vertebrate retina
- Other Figures
- All Figure Page
- Back to All Figure Page
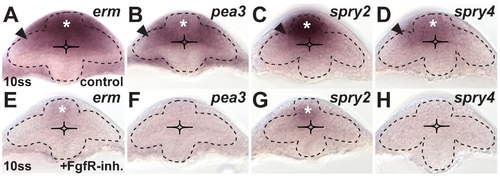
Target gene expression shows active Fgf signaling in the dorsal optic vesicle leaflet. Expression of the Fgf target genes erm, pea3, spry2, and spry4 at the 10ss stage in the optic vesicle of control embryos (A–D) and embryos after FgfR-inhibitor treatment (E–H). (A) erm is strongly expressed in the dorsal forebrain (asterisk) and the dorsal optic vesicle leaflet (arrowhead) of the control. (E) Remnant erm expression is only found in the dorsal forebrain in inhibitor treated embryos (asterisk). (B) pea3 is weakly expressed in the dorsal forebrain (asterisk) but stronger in the proximal part of the dorsal optic vesicle leaflet (arrowhead) of the control. (F) Inhibitor-treated embryos show no pea3 expression. (C) spry2 is strongly expressed in the dorsal forebrain (asterisk) and the proximal part of the dorsal optic vesicle leaflet (arrowhead) of the control. (G) Remnant spry2 expression is only found in the dorsal forebrain of inhibitor treated embryos (asterisk). (D) spry4 is weakly expressed in the dorsal forebrain (asterisk) and in the proximal part of the dorsal optic vesicle leaflet (arrowhead) of the control. (H) Inhibitor-treated embryos show no spry4 expression. All images are cross-sections, dorsal to the top; dotted lines: neural tube boundary. |