
Fig. 2
- ID
- ZDB-FIG-090928-3
- Publication
- Cerda et al., 2009 - RNA profiling of FAC-sorted neurons from the developing zebrafish spinal cord
- Other Figures
- All Figure Page
- Back to All Figure Page
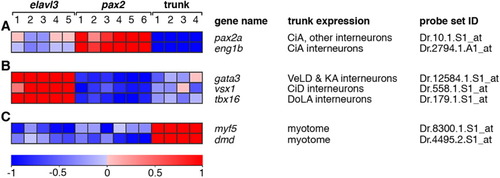
Expression profiles of control genes predicted to be differentially expressed between experimental groups. The relative expression profiles of seven transcripts are shown. These transcripts were predicted, based on previous studies, to be differentially expressed between the experimental groups (see main text for references). The gene name, major site of expression in the trunk region dorsal to the yolk extension at prim stage 10/11, and the corresponding Affymetrix probe set identifier are shown for each gene. A: Expression of two markers of CiA interneurons, pax2a and eng1b, show highest expression in the Tg(pax2a:GFP) experimental group relative to the other two groups. B: Markers of other, defined spinal interneurons show the highest relative expression in the Tg(elavl3:EGFP) experimental group and the lowest relative expression in the Tg(pax2a:GFP) experimental group. C: Two markers of developing myotome, myf5 and dystrophin (dmd), have the highest relative expression in the trunk group. Expression profiles depict normalised expression data from each gene transformed to a mean of zero and standard deviation of one with a colour scale of +1 standard deviation (red) to -1 standard deviation (blue) (www.gepas.org; Montaner et al.,[2006]). Any expression values originally further than ±1 standard deviation from the mean are shown as shown as ±1 standard deviation. Individual RNA samples for each group are numbered as in Table 1. The expression scale is in units of standard deviation. |