
FIGURE
Fig. S1
- ID
- ZDB-FIG-090113-45
- Publication
- Cerda et al., 2009 - RNA profiling of FAC-sorted neurons from the developing zebrafish spinal cord
- Other Figures
- All Figure Page
- Back to All Figure Page
Fig. S1
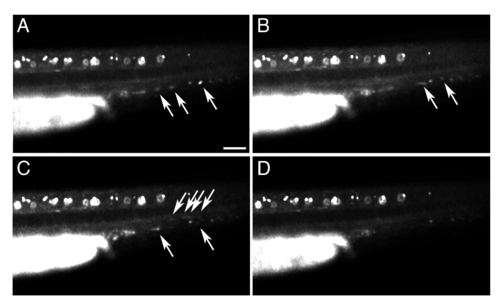
GFP expression in circulating blood cells in Tg(pax2a:GFP) embryos. Fluorescent microscopy images of a live, prim-11 stage (27 hpf) Tg(pax2a:GFP) embryo showing expression of GFP in circulating blood cells (arrows). The embryo was anaesthetised with tricaine and images were taken at consecutive time points (in order A, B, C, D) approximately one second apart. GFP-labelled blood cells can be seen moving posteriorly through the dorsal aorta and returning anteriorly through the posterior cardinal vein. The embryo is oriented with anterior to the left and dorsal up. Scale bar = 50 μm. |
Expression Data
| Gene: | |
|---|---|
| Fish: | |
| Anatomical Term: | |
| Stage: | Prim-5 |
Expression Detail
Antibody Labeling
Phenotype Data
Phenotype Detail
Acknowledgments
This image is the copyrighted work of the attributed author or publisher, and
ZFIN has permission only to display this image to its users.
Additional permissions should be obtained from the applicable author or publisher of the image.
Full text @ Dev. Dyn.