
FIGURE
Fig. 3
- ID
- ZDB-FIG-090826-14
- Publication
- Fu et al., 2009 - The Molecular Structures and Expression Patterns of Zebrafish Troponin I Genes
- Other Figures
- All Figure Page
- Back to All Figure Page
Fig. 3
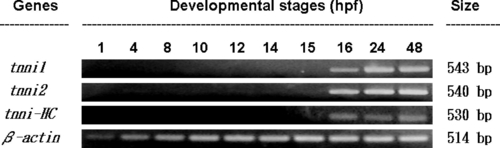
Using reverse transcriptase-polymerase chain reaction (RT-PCR) to detect the temporal expression patterns of zebrafish tnni genes during the early development. Total RNA was isolated from different developmental stages (hours of post-fertilization; hpf) as indicated. Specific primers were designed for detecting the existence of tnni1, tnni2, and tnni-HC transcripts. The expected molecular size of each DNA fragment after RT-PCR amplification was indicated on the right. Three types of tnni genes started to be transcribed in 16 hpf. The β-actin transcript was used as an internal control. |
Expression Data
| Genes: | |
|---|---|
| Fish: | |
| Anatomical Term: | |
| Stage Range: | 4-cell to High-pec |
Expression Detail
Antibody Labeling
Phenotype Data
Phenotype Detail
Acknowledgments
This image is the copyrighted work of the attributed author or publisher, and
ZFIN has permission only to display this image to its users.
Additional permissions should be obtained from the applicable author or publisher of the image.
Reprinted from Gene expression patterns : GEP, 9(5), Fu, C.Y., Lee, H.C., and Tsai, H.J., The Molecular Structures and Expression Patterns of Zebrafish Troponin I Genes, 348-356, Copyright (2009) with permission from Elsevier. Full text @ Gene Expr. Patterns