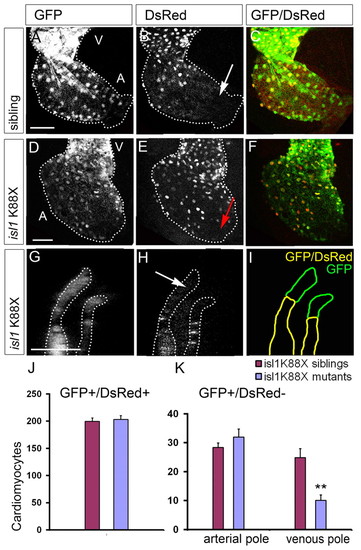
Reduced cardiomyocyte differentiation at the venous pole in isl1 mutant embryos. (A-F) Single z-scan of the atrium of a representative isl1K88X sibling (A-C) and mutant (D-F) embryo. White arrow (B) indicates eGFPposDsRedneg cardiomyocytes at the venous pole of the wild-type sibling heart; red arrow (E) indicates the venous pole of the isl1 mutant where only very few eGFPposDsRedneg cells are present. (G,H) Single z-scan of a confocal image at the level of the arterial pole showing the eGFPposDsRedneg cardiomyocytes in the isl1 mutant (white arrow). The region shown is similar to that of the control embryo shown in Fig. 2G-I. V, ventricle: A, atrium. Scale bar: 50 μm. (I) Schematic of the location of the eGFPposDsRedpos cells (yellow) and the eGFPposDsRedneg (green) cells in the arterial pole of the isl1 mutant. (J,K) The number of eGFPposDsRedpos (J) and eGFPposDsRedneg (K) cardiomyocytes per embryo. (K) The eGFPposDsRedneg cardiomyocytes are subdivided into eGFPposDsRedneg cells being present at either the arterial or the venous pole. Note the significant reduction of eGFPposDsRedneg cells at the venous pole in the isl1 mutants. Bars represent mean±s.e.m. **P<0.01.
|
