
Fig. 5
- ID
- ZDB-FIG-090421-5
- Publication
- Sakamoto et al., 2009 - Heterochronic shift in Hox-mediated activation of sonic hedgehog leads to morphological changes during fin development
- Other Figures
- All Figure Page
- Back to All Figure Page
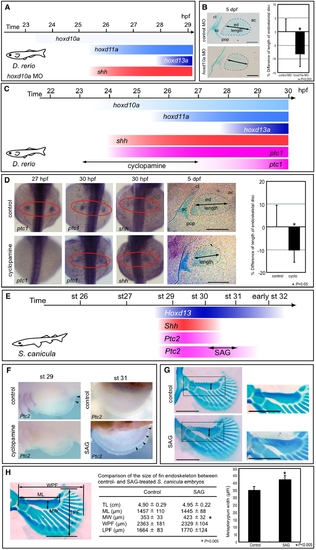
Temporal shift of Shh activity leads to changes in pectoral fin morphology. (A) shh expression appears at 25.5 hpf in pectoral fin primordia of D. rerio embryos injected with 5 ng of hoxd10a MO. (B) At 5 dpf, pectoral fins of embryos injected with control MO or with hoxd10a MO were stained with Alcian Blue (left). Cleithrum (cl), scapulocoracoid (sc), postcoracoid process (pop), endoskeletal disc (ed) and actinotrichs (ac) are indicated. Scale bars: 100 μm. The relative lengths of the endoskeletal disc are presented in the graph (right). *P<0.001, as assessed by Student's t-test. (C) shh expression appears at 24 hpf, concomitantly with hoxd10a, in pectoral fin primordia of D. rerio. Hedgehog signaling was blocked by treatment with 60 μM cyclopamine from 23 to 27 hpf, resulting in ablation of ptc1 expression until at least 27 hpf. ptc1 expression was recovered by 30 hpf in pectoral fin primordia of cyclopamine-treated embryos. (D) ptc1 and shh expression were examined in control or cyclopamine-treated embryos at the indicated stages (left). At 5 dpf, pectoral fins of control or cyclopamine-treated embryos were stained with Alcian Blue (middle). Scale bars: 200 μm. The relative lengths of the endoskeletal disc are represented in a graph (right). *P<0.05, as assessed by Student's t-test with Welch's correction. (E) Shh and Ptc2 expression disappeared before stage 31 in pectoral fin buds of S. canicula embryos. Hedgehog signaling was extended by treatment with SAG for 6 days from stage 30 to 31, resulting in extension of Ptc2 expression until at least stage 31. (F) Ptc2 expression was examined in control or SAG-treated embryos at stage 31 (5 days after the initial treatment). (G) Pectoral fins of control or SAG-treated embryos were stained with Alcian Blue. Anterior is to the left. Proximal is to the top. Insets show magnified views of the pectoral fin metapterygium. Note that the width of the metapterygium (arrows) of SAG-treated embryos was significantly increased. Scale bars: 1 mm. (H) Comparison of the size of the pectoral fin endoskeleton between control and SAG-treated S. canicula embryos. The table shows the total body length (TL), metapterygium length (ML), metapterygium width (MW), width across the base of pectoral fin endoskeleton (WPF), and length of pectoral fin endoskeleton (LPF) of control and SAG-treated embryos. The metapterygium lengths are represented in the bar graph. *P<0.05, as assessed by Student's t-test. |