
Fig. 1
- ID
- ZDB-FIG-090401-1
- Publication
- Sonawane et al., 2009 - Lgl2 and E-cadherin act antagonistically to regulate hemidesmosome formation during epidermal development in zebrafish
- Other Figures
- All Figure Page
- Back to All Figure Page
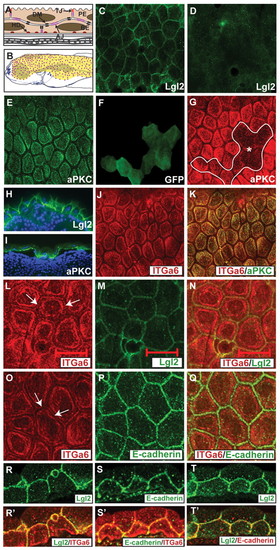
The localisation of Lgl2, aPKC, Itga6 and E-cadherin in 4- to 5-day-old zebrafish basal epidermis. (A,B) Schematic representation of the zebrafish bi-layered epidermis (A) and the epidermal region of 5-day-old larvae (B), which exhibits hemidesmosomes (red dots). (C-T′) Immunostaining using anti-Lgl2 (C,D,H,M,R,T), anti-aPKC (E,G,I,K), anti-GFP (F), anti-Itga6 (J,K,L,O,R′,S′) and anti-E-cadherin (P,S) antibodies. In the basal epidermis, Lgl2 localises to the lateral domain (C,H). Control lgl2 mutant epidermis does not show any specific Lgl2 staining (D). By contrast, aPKC is localised to the basal domain (E,I). Epidermal clones injected with a morpholino against aPKCλ (F) exhibit a reduction in aPKC expression (G). At the basal domain, Itga6 (J,K) and aPKC (K) co-localise. Co-staining of Itga6 and Lgl2 in whole-mounts (L-N) and sections (R,R′), and of Itga6 and E-cadherin in whole-mounts (O-Q) and sections (S,S′), reveals that a minor Itga6 fraction is localised at the lateral domain (arrows in L,O). Co-staining of Lgl2 and E-cadherin in sections reveals an overlap in their localisation (T,T′). Asterisk, basal epidermal clone. PE, periderm; BE, basal epidermis; AJ, adherens junctions; DM, desmosomes; HD, hemidesmosomes; TJ, tight junctions. Scale bar: 40 μm in C-G,J,K; 22.5μm in H,I; 20μm in L-T′. |