
FIGURE
Fig. 4
- ID
- ZDB-FIG-081222-15
- Publication
- Kagemann et al., 2008 - Repeated, noninvasive, high resolution spectral domain optical coherence tomography imaging of zebrafish embryos
- Other Figures
- All Figure Page
- Back to All Figure Page
Fig. 4
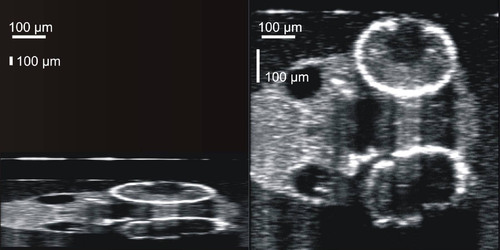
Images were resampled to correct the irregular data density of the raw scans. The Z axis (vertical axis of the image) is fixed at 1,024 reflectance measurements along a 2 mm line. A X,Y scanning pattern was optimized for the body of the animal, with a X,Y a-scan density of 501x180, yielding the uncorrected aspect ratio observed in the left frame. Scan data were resampled, utilizing spline interpolation, to produce images with a 1:1 aspect ratio for structural measurements and visualization. |
Expression Data
Expression Detail
Antibody Labeling
Phenotype Data
Phenotype Detail
Acknowledgments
This image is the copyrighted work of the attributed author or publisher, and
ZFIN has permission only to display this image to its users.
Additional permissions should be obtained from the applicable author or publisher of the image.