
Fig. 4
- ID
- ZDB-FIG-081111-23
- Publication
- Linney et al., 1999 - Transgene expression in zebrafish: a comparison of retroviral-vector and DNA-injection approaches
- Other Figures
- All Figure Page
- Back to All Figure Page
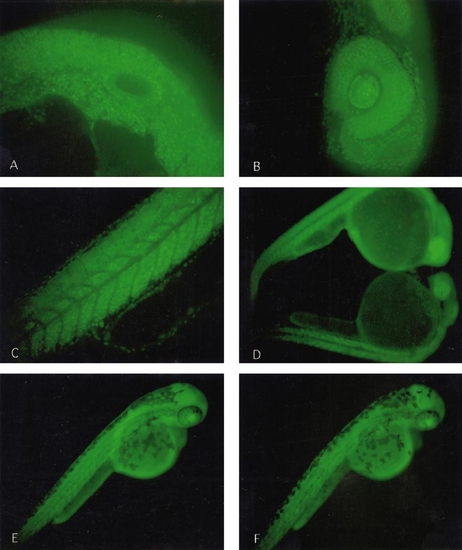
(A, B, and C) Low-power Nipkow disk confocal sections of the embryo illustrated in Fig. 3. These images are of a retroviral vector-produced transgenic embryo. (D, E, and F) Transgenic embryos derived from DNA microinjection. (A) is a section through otic vesicle, (B) is a section through the eye, and (C) is a sagittal section through the tail. Note the nuclear localization of the GFP signal. (D) is a comparison of embryos of the Ef1 α-39 line at 24 h. The upper embryo is derived from a female transgenic parent and the lower embryo is derived from a male transgenic parent. Note that even at 24 h there is a noticeable increase in the GFP signal of the embryo from the female parent. (E) is a 48-h embryo from a female parent and (F) is a 48-h embryo from a male parent. The difference is GFP signal diminishes by this developmental time. |
Reprinted from Developmental Biology, 213(1), Linney, E., Hardison, N.L., Lonze, B.E., Lyons, S., and DiNapoli, L., Transgene expression in zebrafish: a comparison of retroviral-vector and DNA-injection approaches, 207-216, Copyright (1999) with permission from Elsevier. Full text @ Dev. Biol.