
Fig. 6
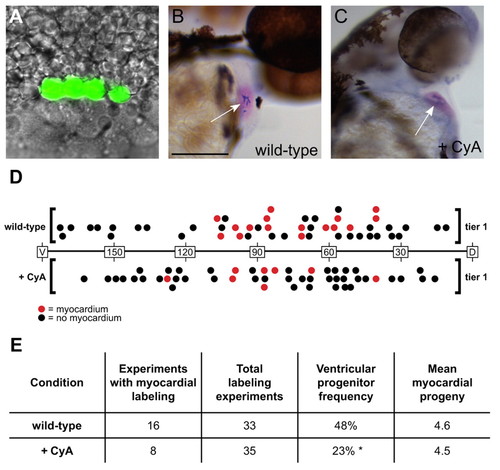
Embryos with reduced Hedgehog signaling contain fewer myocardial progenitors. (A) Example of a 40% epiboly embryo in which four adjacent blastomeres in the first row above the embryonic margin (tier 1) were labeled by photoactivation of caged fluorescein-dextran. Fluorescein is pseudocolored in green and superimposed on a DIC image. (B,C) 48 hpf embryos with labeled contributions to ventricular myocardium. (B) Six labeled cardiomyocytes found within a wild-type ventricle. Scale bar: 100 μm. (C) Five labeled cardiomyocytes found within a CyA-treated ventricle. Myocardium is visualized via in situ hybridization for cmlc2 (pink) and labeled cells are marked in blue (arrows). (D) 40% epiboly myocardial fate maps of tier 1 blastomeres in wild-type and CyA-treated embryos. Wild-type fate map is shown above the horizontal axis and CyA-treated fate map is shown below the axis. Longitude coordinates of the margin are depicted with dorsal as the origin (0°) and ventral as 180°. Each circle represents an individual labeling experiment. Red circles represent experiments in which the labeled blastomeres contributed to ventricular myocardium, and black circles represent embryos in which the labeled cells did not become cardiomyocytes. The position of each circle indicates the median longitude value of the labeled blastomeres. Experiments from the left and right sides are merged for convenience of presentation. (E) Results from fate-mapping experiments conducted 50°-125° from dorsal, the region within tier 1 where ventricular myocardial progenitors are found. A ratio of the number of experiments yielding labeled ventricular myocardium to the total number of experiments was used to determine the ventricular progenitor frequency. Asterisk indicates a statistically significant difference from wild-type (P=0.0418, Fisher's exact test). The mean number of myocardial progeny per embryo was determined by counting labeled cardiomyocytes in relevant cases (see Table S5 in the supplementary material). |