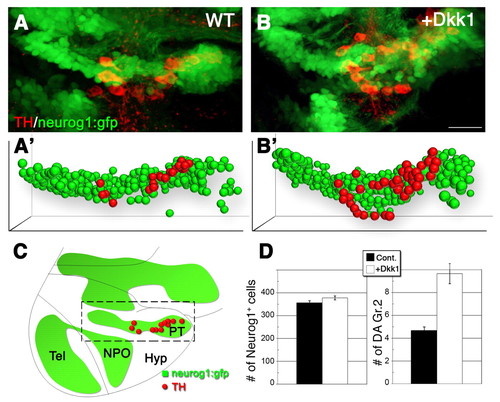
Specific neurog1+ precursor pools differentially respond to Wnt signaling. (A,B) Projected confocal z-stack images (lateral view) of DA (red) and neurog1+ (green) cells in neurog1::gfp transgenic zebrafish reporter embryos. Embryos were injected with either a vehicle solution (A) or an mRNA encoding Dkk1 (B). (A′,B′) Bubble-plot graphic representation of the x, y, z cell position of all neurog1+ (green) and DA (TH+ neurog1+) cells (red) in the PT. Bubble size was derived from the position of the cells along the z-axis to give the impression of depth. (C) Schematic depicting the major diencephalic DA cell groups in the developing embryo at 48 hpf, relative to the neurog1::gfp expression domains. The area indicated by the dashed box corresponds to the posterior tuberculum domain as shown at high-magnification in A,B. (D) Bar charts showing the averaged number of neurog1+ and DA (TH+ neurog1+) cells in embryos that were injected with either a vehicle solution or dkk1 mRNA (n=5). Hyp, hypothalamus; NPO, neurosecretory preoptic nucleus; PT, posterior tuberculum; Tel, telencephalon. Scale bar: 25 μm.
|
