
FIGURE
Fig. 4
- ID
- ZDB-FIG-080916-16
- Publication
- Jones et al., 2008 - A High Throughput Live Transparent Animal Bioassay to Identify Non-toxic Small Molecules or Genes that Regulate Vertebrate Fat Metabolism for Obesity Drug Development
- Other Figures
- All Figure Page
- Back to All Figure Page
Fig. 4
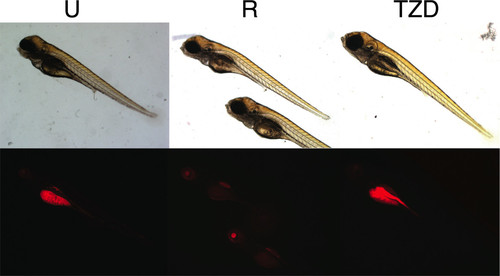
Pharmacology causing decreases or increases in fat metabolism is visually detectable in a quantitative fashion by using live zebrafish nile red fluorescence microscopy. Zebrafish were incubated with daily refreshing of fish water containing nile red with or without 100 μM resveratrol (R) or 10 nM troglitazone (TZD). Exposure time for all fluorescent images was set to that of untreated zebrafish (left). Bright field images are provided to show lack of overt toxicity. |
Expression Data
Expression Detail
Antibody Labeling
Phenotype Data
| Fish: | |
|---|---|
| Conditions: | |
| Observed In: | |
| Stage: | Days 7-13 |
Phenotype Detail
Acknowledgments
This image is the copyrighted work of the attributed author or publisher, and
ZFIN has permission only to display this image to its users.
Additional permissions should be obtained from the applicable author or publisher of the image.
Open Access.
Full text @ Nutr. Metab. (Lond).