
Fig. S2
- ID
- ZDB-FIG-080829-33
- Publication
- England et al., 2006 - A dynamic fate map of the forebrain shows how vertebrate eyes form and explains two causes of cyclopia
- Other Figures
- All Figure Page
- Back to All Figure Page
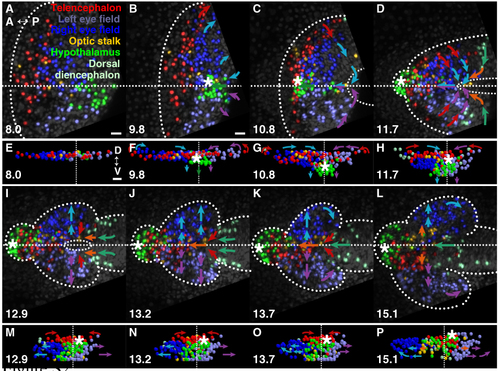
The resolution of bilateral eyes during forebrain neurulation. (A-D,I-L) Projection images of GFP-labelled nuclei. (E-H,M-P) 3D projections of tracked cells. Arrows indicate the direction of major tissue movement. Dotted line, neural boundary; dashed lines, dorsal midline, neuropore. (A-D,I-L) Dorsal views, anterior is left; (E-H, M-P) frontal views, dorsal is up. (A,E) Forebrain regions prior to neurulation. Cells of the left and right eyes are intermixed at the midline. Left and right eye-field cells remain intermixed throughout the period of posterior contraction of the anterior neural plate (B,F) and throughout subduction of the hypothalamus (asterisk) beneath the medial eye field (C,D,G,H). (I, M) Sorting of eye tissue into the appropriate vesicles begins with the movement of cells away from the midline during evagination, (J-L, N-P) and continues coincident with the closure by the telencephalon of the neuropore, and the convergence and anterior-ward movement of the dorsal diencephalon. hpf, hours post fertilisation. Scale bars: 25 μm. |