
FIGURE
Fig. 3
- ID
- ZDB-FIG-080513-26
- Publication
- Hjorth et al., 2001 - Are pioneer axons guided by regulatory gene expression domains in the zebrafish forebrain? High-resolution analysis of the patterning of the zebrafish brain during axon tract formation
- Other Figures
- All Figure Page
- Back to All Figure Page
Fig. 3
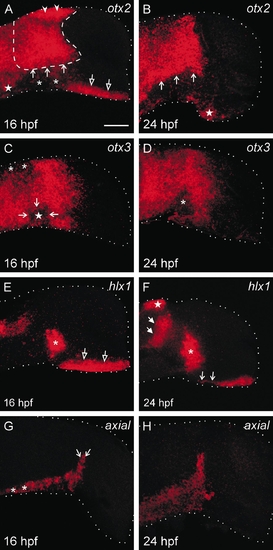
Confocal laser scanning microscope Z-series images of lateral views of whole-mount zebrafish brains showing the expression patterns of regulatory genes (red) at 16 (A, C, E, G) and 24 hpf (B, D, F, H). Rostral is to the right and dorsal is to the top. The outline of the brain is indicated by a dotted line. (A, B) otx2 expression in the zebrafish brain at 16 and 24 hpf. (C, D) otx3 expression in the zebrafish brain at 16 and 24 hpf. (E, F) hlx1 expression in the zebrafish brain at 16 and 24 hpf. (G) axial expression in the zebrafish brain at 16 and 24 hpf. Scale bar (A–H), 50 μm. |
Expression Data
Expression Detail
Antibody Labeling
Phenotype Data
Phenotype Detail
Acknowledgments
This image is the copyrighted work of the attributed author or publisher, and
ZFIN has permission only to display this image to its users.
Additional permissions should be obtained from the applicable author or publisher of the image.
Reprinted from Developmental Biology, 229(2), Hjorth, J.T. and Key, B., Are pioneer axons guided by regulatory gene expression domains in the zebrafish forebrain? High-resolution analysis of the patterning of the zebrafish brain during axon tract formation, 271-286, Copyright (2001) with permission from Elsevier. Full text @ Dev. Biol.