
FIGURE
Fig. 1
- ID
- ZDB-FIG-080506-35
- Publication
- Du et al., 2001 - Visualizing normal and defective bone development in zebrafish embryos using the fluorescent chromophore calcein
- Other Figures
- All Figure Page
- Back to All Figure Page
Fig. 1
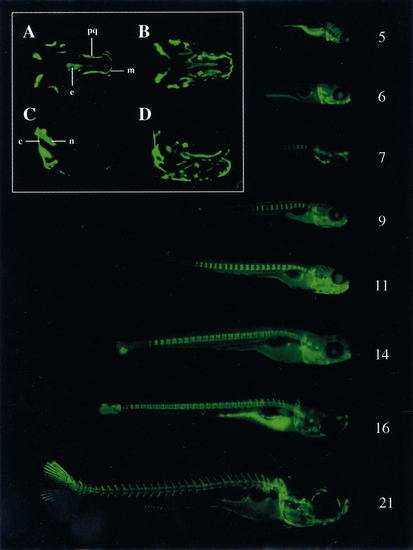
Visualization of calcified skeletal structures in developing zebrafish embryos at 5, 6, 7, 9, 11, 14, 16, and 21 dpf by calcein staining. (A, B) Ventral view of the head skeleton of day-7 (A) and -11 (B) embryos labeled with calcein. m, Meckel’s cartilage; pq, palatoquadrate; e, ethmoid plate. (C, D) Side view of the head skeleton of day-7 (A) and -11 (B) embryos labeled with calcein. n, notochord; c, cleitrum. |
Expression Data
Expression Detail
Antibody Labeling
Phenotype Data
Phenotype Detail
Acknowledgments
This image is the copyrighted work of the attributed author or publisher, and
ZFIN has permission only to display this image to its users.
Additional permissions should be obtained from the applicable author or publisher of the image.
Reprinted from Developmental Biology, 238(2), Du, S., Frenkel, V., Kindschi, G., and Zohar, Y., Visualizing normal and defective bone development in zebrafish embryos using the fluorescent chromophore calcein, 239-246, Copyright (2001) with permission from Elsevier. Full text @ Dev. Biol.