|
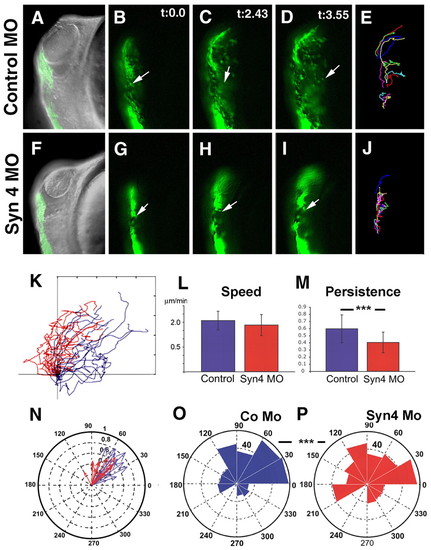
Syn4 controls the persistence of NC migration. A sox10:egfp zebrafish transgenic line was used to analyze NC migration in vivo. (A-D,F-I) Time lapse of embryos at 16 hpf carried out for 4 hours, three frames (t=0.0 min, t=2.43 min and t=3.55 min) are shown; first frame is also overlapped with a DIC image. Dorsal to the left; anterior to the top. Arrow indicates an individual cell as an example. (E,J) Trajectories of 4 hours of migration. (A-E) Control MO; (F-J) syn4 MO. (K) Trajectories of cells from different experiments. Blue, control MO; red, syn4 MO. (L) Velocity of migration. (M) Persistence of migration. (N) Angle of migration for each individual cell. Blue, control MO; red, syn4 MO. (O,P) Rose plot showing the distribution of angles of each time point during the 4 hours of migration. The area of each bin represents the number of cells moving in that direction. (O) Control MO; (P) syn4 MO. ***P<0.005.
|