
FIGURE
Fig. 6
- ID
- ZDB-FIG-071223-22
- Publication
- Nogare et al., 2007 - Zebrafish cdc25a is expressed during early development and limiting for post-blastoderm cell cycle progression
- Other Figures
- All Figure Page
- Back to All Figure Page
Fig. 6
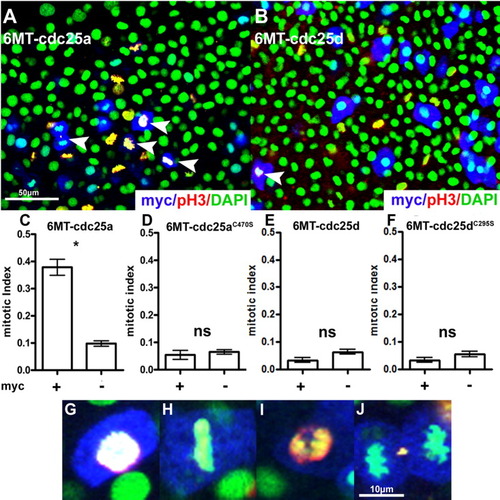
Overexpression of cdc25a and cdc25d in gastrulating zebrafish embryos. a,b: Example fields from either cdc25a or cdc25d expressing embryos following heatshock and staining. c-f: Mitotic index quantification. *P <0.01; ns, not significant. For cdc25a, n = 14 fields, and for cdc25d, n = 8 fields. See Experimental Procedures for details. g-j: Enlarged images of cdc25a expressing (myc+) cells in various phases of mitosis. Stains are as indicated in the lower right of a and b. White arrowheads in a and b indicate Myc-positive (therefore cdc25-positive) mitotic figures. |
Expression Data
Expression Detail
Antibody Labeling
Phenotype Data
Phenotype Detail
Acknowledgments
This image is the copyrighted work of the attributed author or publisher, and
ZFIN has permission only to display this image to its users.
Additional permissions should be obtained from the applicable author or publisher of the image.
Full text @ Dev. Dyn.