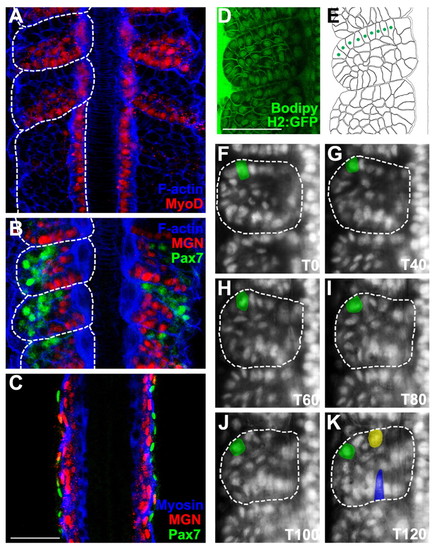
Distinct anterior and posterior domains in the epithelial somite. (A) In a 12S (15 hours) embryo, MyoD (red) is expressed in nuclei in the posterior of newly formed somites and in adaxial cells of the anterior segmental plate. (B) In the anterior of a 14S (16 hours) embryo, myogenin labeling (red) is in the posterior and medial somite, whereas Pax7 (green) is restricted to anterior and lateral. (C) In a 24-hour embryo, Pax7-labeled nuclei (green) are on the external myotome surface, whereas myogenin labeled nuclei (red) are more medial. (D) Bodipy ceramide-stained Histone H2:GFP 12S embryo. (E) Cells from the embryo in D are outlined, anterior border cells (ABCs) are marked by green dots. (F-K) Selected time-lapse images of green, GFP-labeled nuclei. T, time in minutes from the commencement of analysis. An individual ABC is pseudo-coloured green and tracked through individual frames. (K) An additional ABC is pseudo-coloured yellow in the same medio-lateral position as an elongating posterior cell in blue. (A-K) Dorsal views, anterior to the top, the midline is in the center in A-C, at the right in D-K. Scale bars: 50 μm in C for A-C, and 50 μm in D for D-K.
|
