
Fig. 6
- ID
- ZDB-FIG-071115-8
- Publication
- Villefranc et al., 2007 - Gateway compatible vectors for analysis of gene function in the zebrafish
- Other Figures
- All Figure Page
- Back to All Figure Page
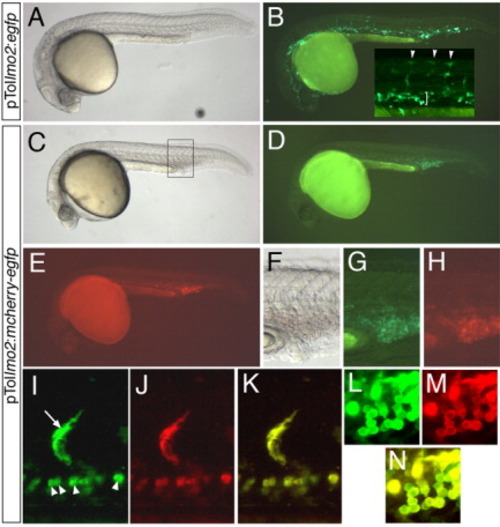
Validation of pTollmo2-Dest vectors. A-N: Injected embryos at 28 hours postfertilization, lateral views, dorsal is up, anterior to the left. A,B: Embryo injected with 25 pg of pTollmo2:egfp and 25 pg of transposase mRNA. A: Transmitted light image. B: Fluorescent image of embryo in A to visualize enhanced green fluorescent protein (Egfp) expression. Inset, higher magnification of trunk region, indicating Egfp expression in numerous segmental arteries (arrowheads) and intermediate cell mass (bracket). C-N: Embryos injected with 25 pg of pTollmo2:mcherry-egfp and 25 pg of transposase mRNA. C,F: Transmitted light image. D,G: Epifluorescence image to visualize Egfp expression. E,H: Epifluorescence image to visualize mCherry expression. F-H: Higher magnification view of caudal vein expression from embryo in C (box). I-N: Confocal micrographs; embryo is different than the one pictured in C. I: Green fluorescence of mCherry-Egfp in a segmental artery (arrow) and red blood cells (arrowheads). J: Red fluorescence of mCherry-Egfp. K: Overlay of green and red fluorescence from images in I and J. L: Green fluorescence of mCherry-Egfp in blood cells. M: Red fluorescence of mCherry-Egfp in blood cells. N: Overlay of green and red fluorescence from images in L and M. |